LTC-OSLibrary
LiveChapter 7·Updated 17 Sept 2026

Value Stream Map — the material flow

The end-to-end flow, with the timeline and the waste signals.

Build it

From the palette, place nodes left to right: Supplier → Process steps → Inventory / Supermarket → Customer, plus Shipment and the Production Control box. Connect them with Flows: Material, Push, Electronic info, Manual info, Production kanban (with withdrawal cards).
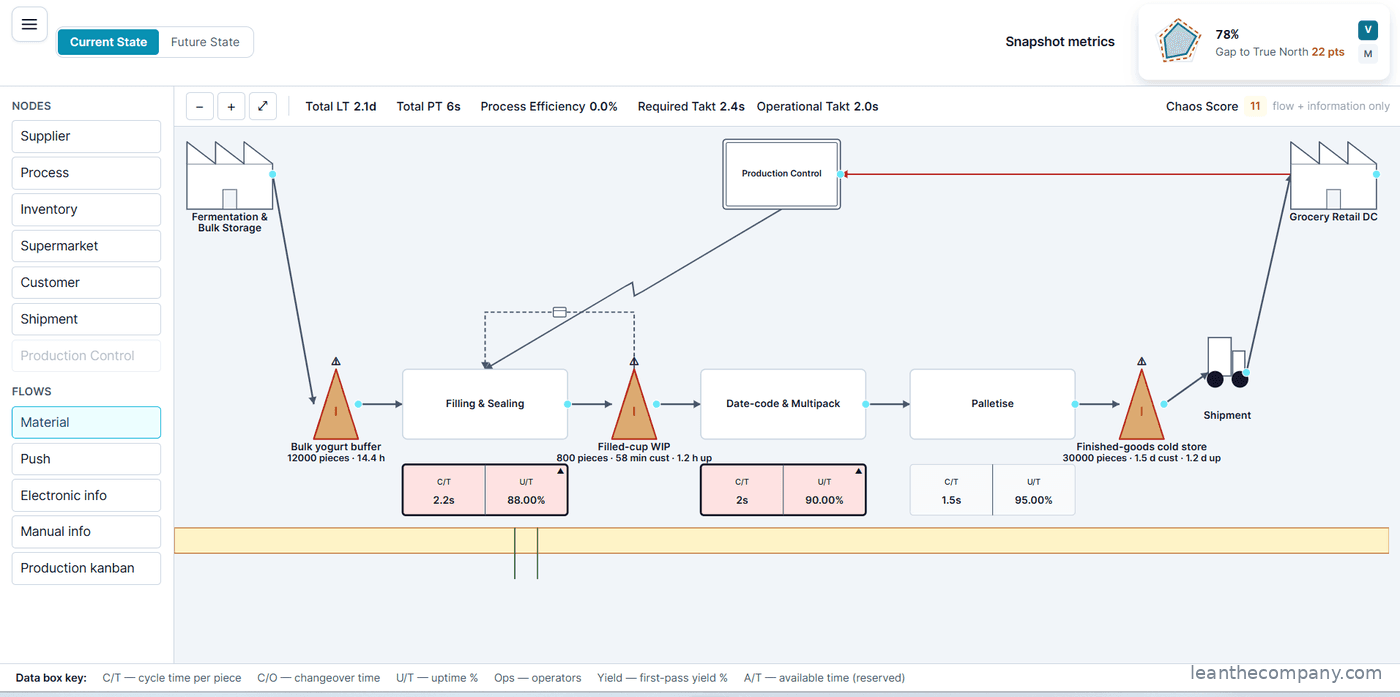
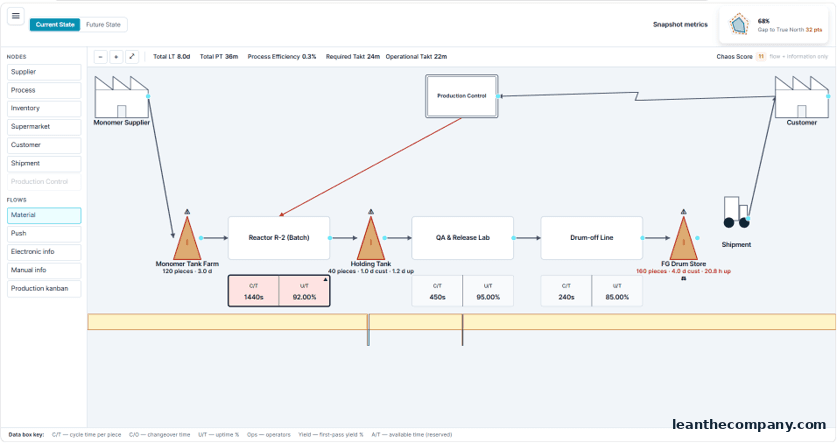
Figure 7.1 — A dairy fill-and-pack value stream — the palette on the left, the data boxes under each step, the lead-time ladder along the bottom.
Figure 7.2 — A batch-chemistry value stream: 8.0 days of lead time against 36 minutes of work.
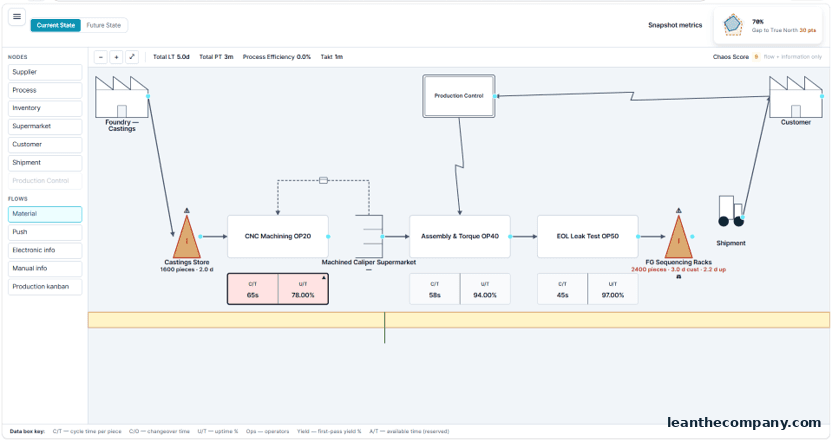
Figure 7.3 — An automotive stream with a supermarket and a production-kanban loop.

Open each process box and fill the data box: C/T, C/O, U/T, Operators, Yield. The Data box key in the corner decodes every abbreviation.
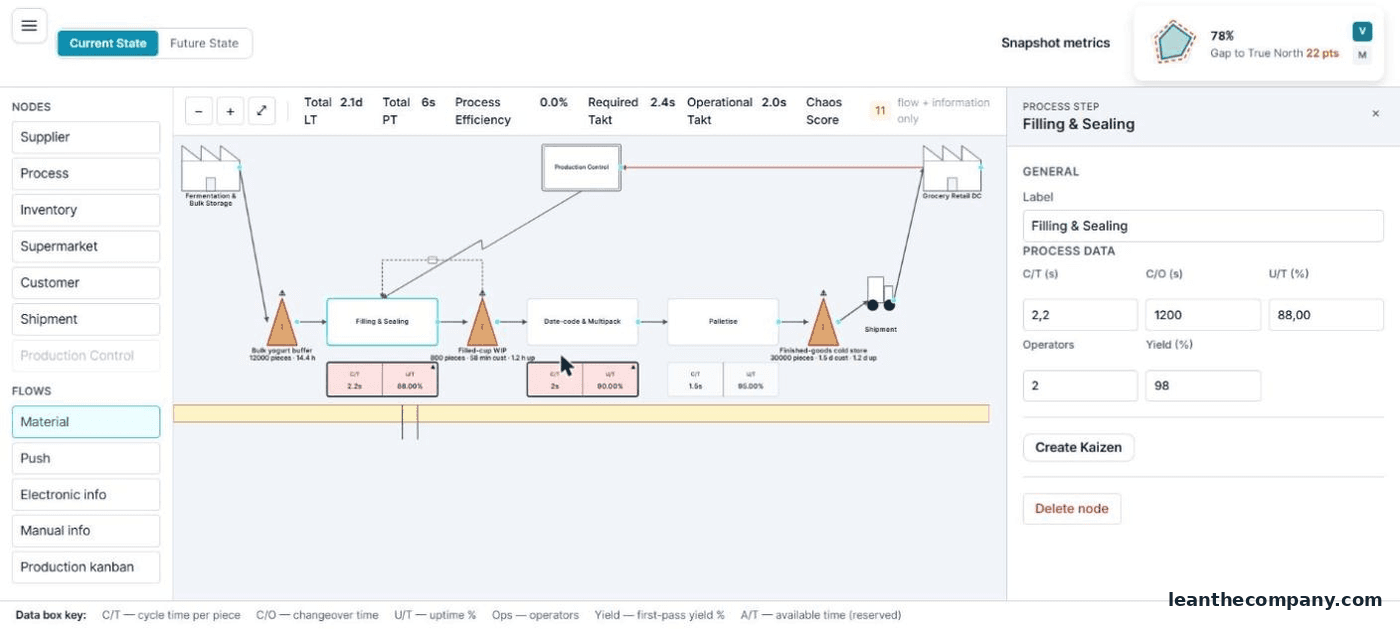
Figure 7.4 — A process box opens on its data box — C/T, C/O, U/T, Operators, Yield — with the data-box key in the corner.

The Production Control box

Where the schedule lives. Give it the operating parameters — Breaks, Meetings, Cleaning, Planned maintenance, Other — and it computes Net available time and the Operational Takt from the customer demand you set in the Value Compass.
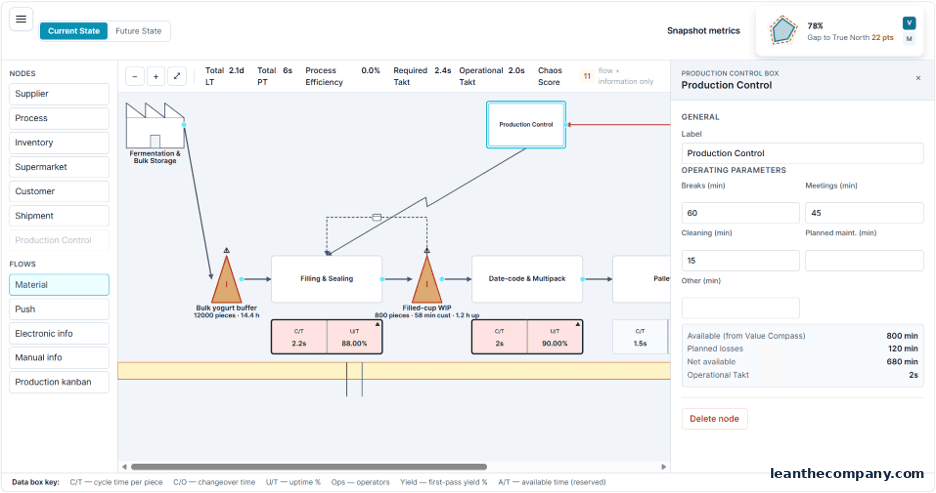
Figure 7.5 — The Production Control drawer: 960 min available → 110 min planned losses → net 850 → the Operational Takt.

Read the header

Total LT · Total PT · Process Efficiency · Takt · Chaos Score — with the lead-time ladder along the bottom. The Chaos Score here is the same five-question instrument as the free diagnostic on the website — except this one is measured from your map, not guessed. Watch the flags: a step over takt, stock at WIP fire-risk, flow that isn't level.

Figure 7.6 — The header, read left to right — and a Chaos Score measured from the map, not guessed.

Current vs Future works as in the Makigami: the Future State is a snapshot-clone you redesign freely.

Tip — Takt and efficiency need the customer demand + available time from the Value Compass. Set those first; the header will remind you if you didn't.