Value Stream Map
Draw the material flow end to end, with data boxes, the lead-time ladder, and the process node that breaks takt.
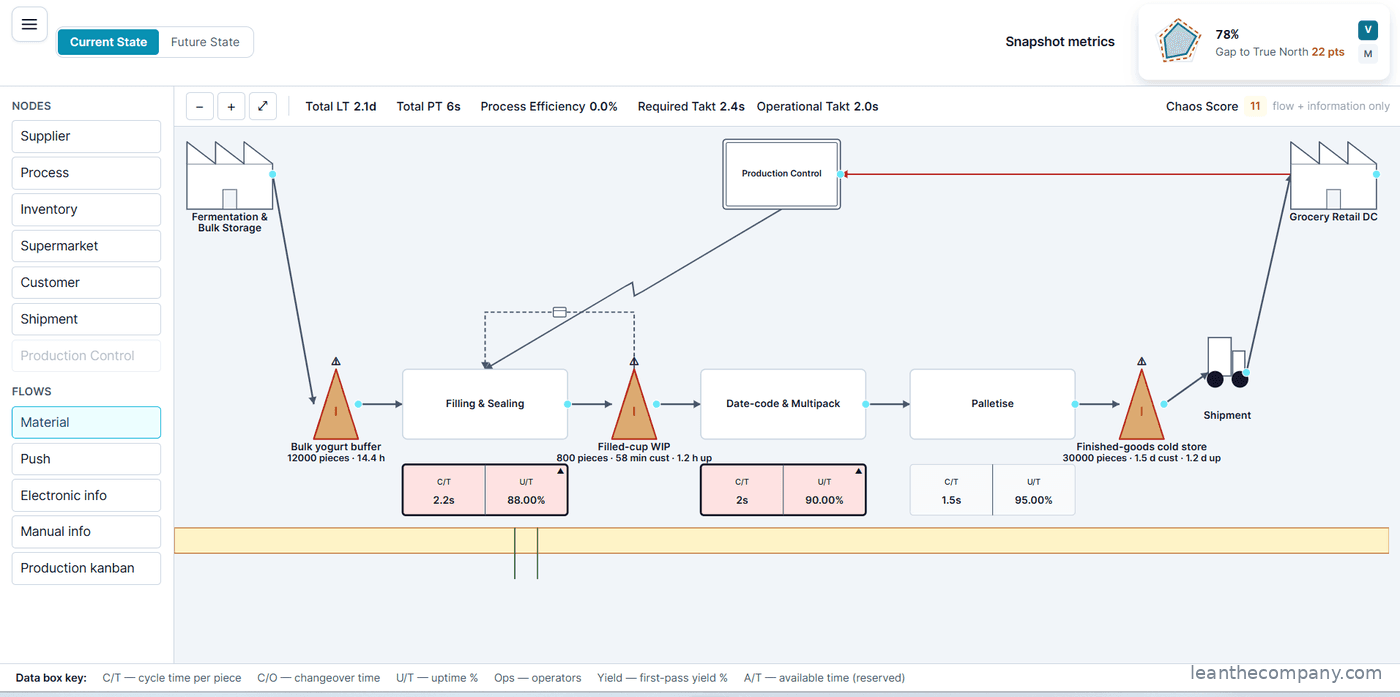
The other half of move three: the material flow, end to end.
You draw it against the takt the Value Compass set, which is what separates this from a flowchart. Data boxes carry the real numbers at each step. The lead-time ladder shows processing against elapsed time, and the gap between those two lines is the argument for doing anything at all.
What it finds is the process node where lead time stops matching demand. Not the slowest step — the one that breaks takt, which is often not the one everybody complains about.
It hands that node to move four. Kaizen does not begin with a blank sheet and a brainstorm; it begins with a map that has already named the place. Where the Makigami is right for office flow, this is right for anything physical.
Where it sits in the loop
Move 3 of 6
see the flow
The maps show the waste.
Shared with Process Map (Makigami)
Chapter 7 walks through this module screen by screen.